







A single survey, channel check, or data point can capture where a market stood in a moment that has passed. Useful as that can be, investment theses often require dynamic data that accounts for movement and momentum – whether the signals behind a company or sector are strengthening, weakening, or changing direction over time.
A tracking survey measures the same indicators at regular intervals, such as customer spending, product adoption, purchase intent, sentiment, pricing, retention, or competitive behavior. The technology available to research teams today has made it easier than ever to scale and synthesize change from one wave to the next, giving analysts more evidence to which they can apply their own interpretation and investment judgment.
A well-executed tracking survey helps you tell isolated movement from a developing market trend and surfaces potential inflection points that may deserve a closer look. To see where demand stands today, start with channel checks.
Market trend tracking measures customer, market, or channel indicators consistently over time, helping investment teams understand how underlying business conditions are changing.
The repetition distinguishes tracking from a one-time survey, which gives a point-in-time snapshot. A recurring survey repeats selected measures at defined intervals, such as quarterly, twice a year, or annually, so you can compare results across research waves.
Tracking research can follow the same signals a one-off channel check covers, like spending, adoption, purchase intent, sentiment, pricing, retention, and channel activity. But repeating all of them can be costly. Three criteria can help you define what signals are worth following over time:
- Moves slowly enough to produce legible results. A metric that swings with seasonality or the news cycle produces noise at a short cadence.
- Means the same thing to respondents over time. Phrasing or wording that drifts in meaning as a market matures will make it hard to compare cleanly between waves.
- Connects to a decision. Track the measures tied to assumptions you would actually revise, not everything you could ask.
Two signals suit repetition particularly well. Customer sentiment is one – a single reading has no baseline, so you can’t tell whether a mood is improving or souring. Channel conditions, such as distributor inventory and order patterns, are the other, since their meaning lies in the sequence of readings. An adoption survey repeated each wave works the same way, showing whether uptake is still climbing or has leveled off.
For investment teams, the direction of change can be as important as the absolute result. Repeated measurement helps reveal whether a signal is stable, strengthening, or deteriorating.
More than any single data point, the sustained decline across three comparable waves represents the signal that could warrant deeper analysis. Market trend research of this kind can surface patterns such as:
- Demand accelerating or decelerating
- Adoption plateauing or declining
- Customer sentiment shifting
- Rising pricing resistance
- Weakening renewal intent or growing competitive consideration
Tracking research can identify changes and potential inflection points, but does not prove future company or investment performance.
Longitudinal market research only works when you can attribute changes in the data to the variables you’re studying, as opposed to the structure of the research itself. Three conditions make that possible:
- Consistent metrics. Track persistent, meaningful measures across research waves.
- Comparable groups. Keep respondent definitions, screening criteria, and relevant profiles stable.
- Consistent methodology. Hold survey wording and sample composition sufficiently comparable over time.
Consistency makes it possible to isolate real trend lines from noise and lowers the risk that an apparent change comes from panel churn or a methodological shift. It also shows whether the market evidence supporting your investment thesis is holding or fraying. A sudden change calls for event-specific work, which is where rapid research after a catalyst comes in.
GLG supports trend tracking by pairing consistent research design with the right expert populations and tooling to repeat it. For portfolio monitoring, that comes down to five key steps:
- Define meaningful metrics. Translate investment questions into persistent, industry-aligned measures such as spend, adoption, and sentiment.
- Maintain relevant cohorts. Field to consistent, pre-vetted customer, distributor, and professional populations within GLG's compliance framework.
- Choose the right method. Combine GLG Surveys, Expert Calls, and AI-Moderated Calls depending on whether you need quantitative tracking, qualitative context, or both.
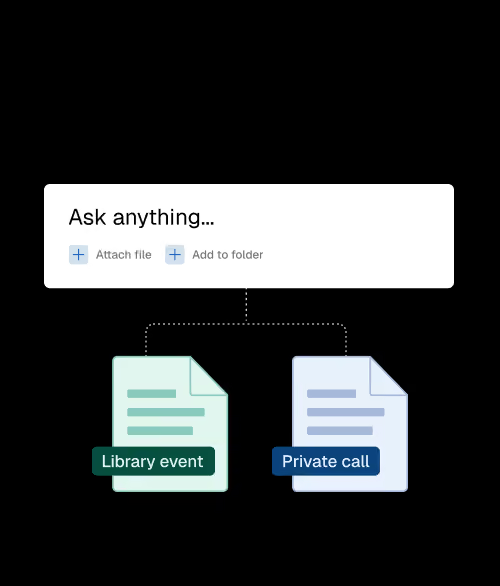
- Synthesize change over time. myGLG AI tools surface themes and patterns across expert research while tracing findings back to source material.
- Deliver for ongoing monitoring. Structured results can arrive via API, trend views, and dashboards, with data that supports recurring analysis and fast internal reporting.
Your analysts still decide what a change means for the thesis. The technology adds consistency and scale to the repetition.
A single reading tells you where a market stands in an instant, not where it’s moving. For most investment questions, the value comes in understanding the direction of travel, which requires repeated measurement.
Speak with GLG's Financial Services team about a tracking survey for a position or sector you monitor.
Contact Us
Enter your contact information below and a member of our team will reach out to you shortly.